
Productivity is usually reported at the level of the case: cases per day, average handle time and cost per contact. These measures are easy to collect and compare, but they average away most of the detail needed to decide what to change.
Identifying what to change requires measurement at lower levels.
Four Levels of Work
Work can be described as a hierarchy with four levels.
Process. An end-to-end outcome, such as onboarding a customer or resolving a billing dispute.
Step. A milestone within the process, such as verifying identity or authenticating the caller.
Task. A unit of work a person performs, such as running a compliance check or verifying identity against the account.
Activity. A discrete action or screen interaction, such as entering an ID, looking up a code in a spreadsheet or searching the account.
Not every piece of work is a full process. Some work consists only of a task and an activity, and the hierarchy should be adapted to the work.
Productivity measurement is useful when it is taken at the level where the work can be changed.
What the Case View Hides
Consider two teams with the same average handle time. One spends most of it in a single application doing focused work. The other splits the same minutes across five applications, with a lookup and a spreadsheet in every case. The headline number is identical, but the appropriate intervention for each team is different.
Case-level measures also hide variation. Team averages obscure the fact that a few people have found a faster path and a few have a workaround that adds a step. A team cannot standardize on the better path if it cannot see it.
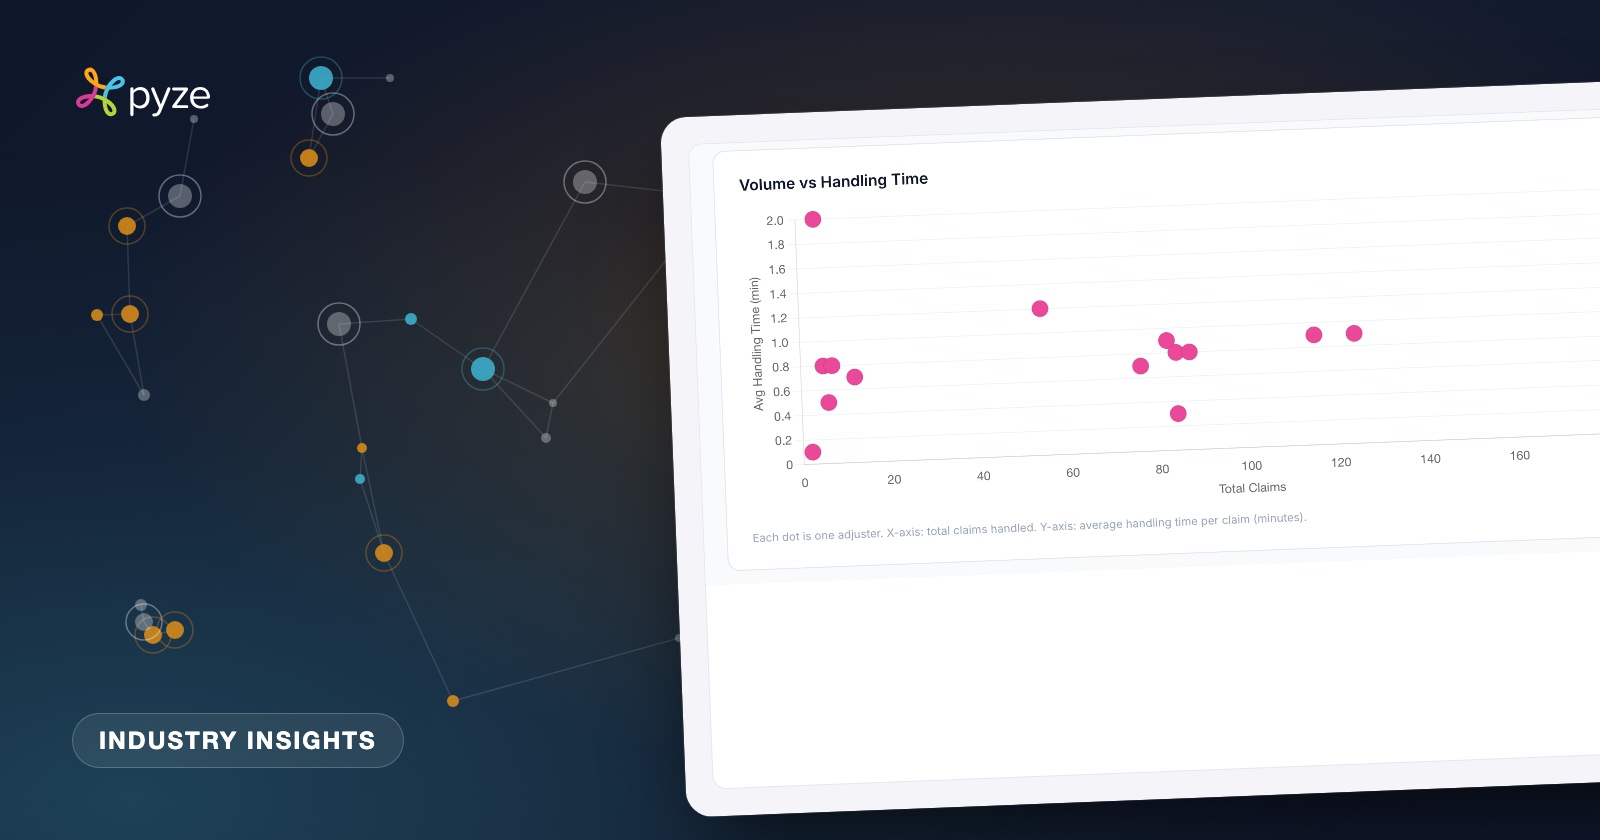
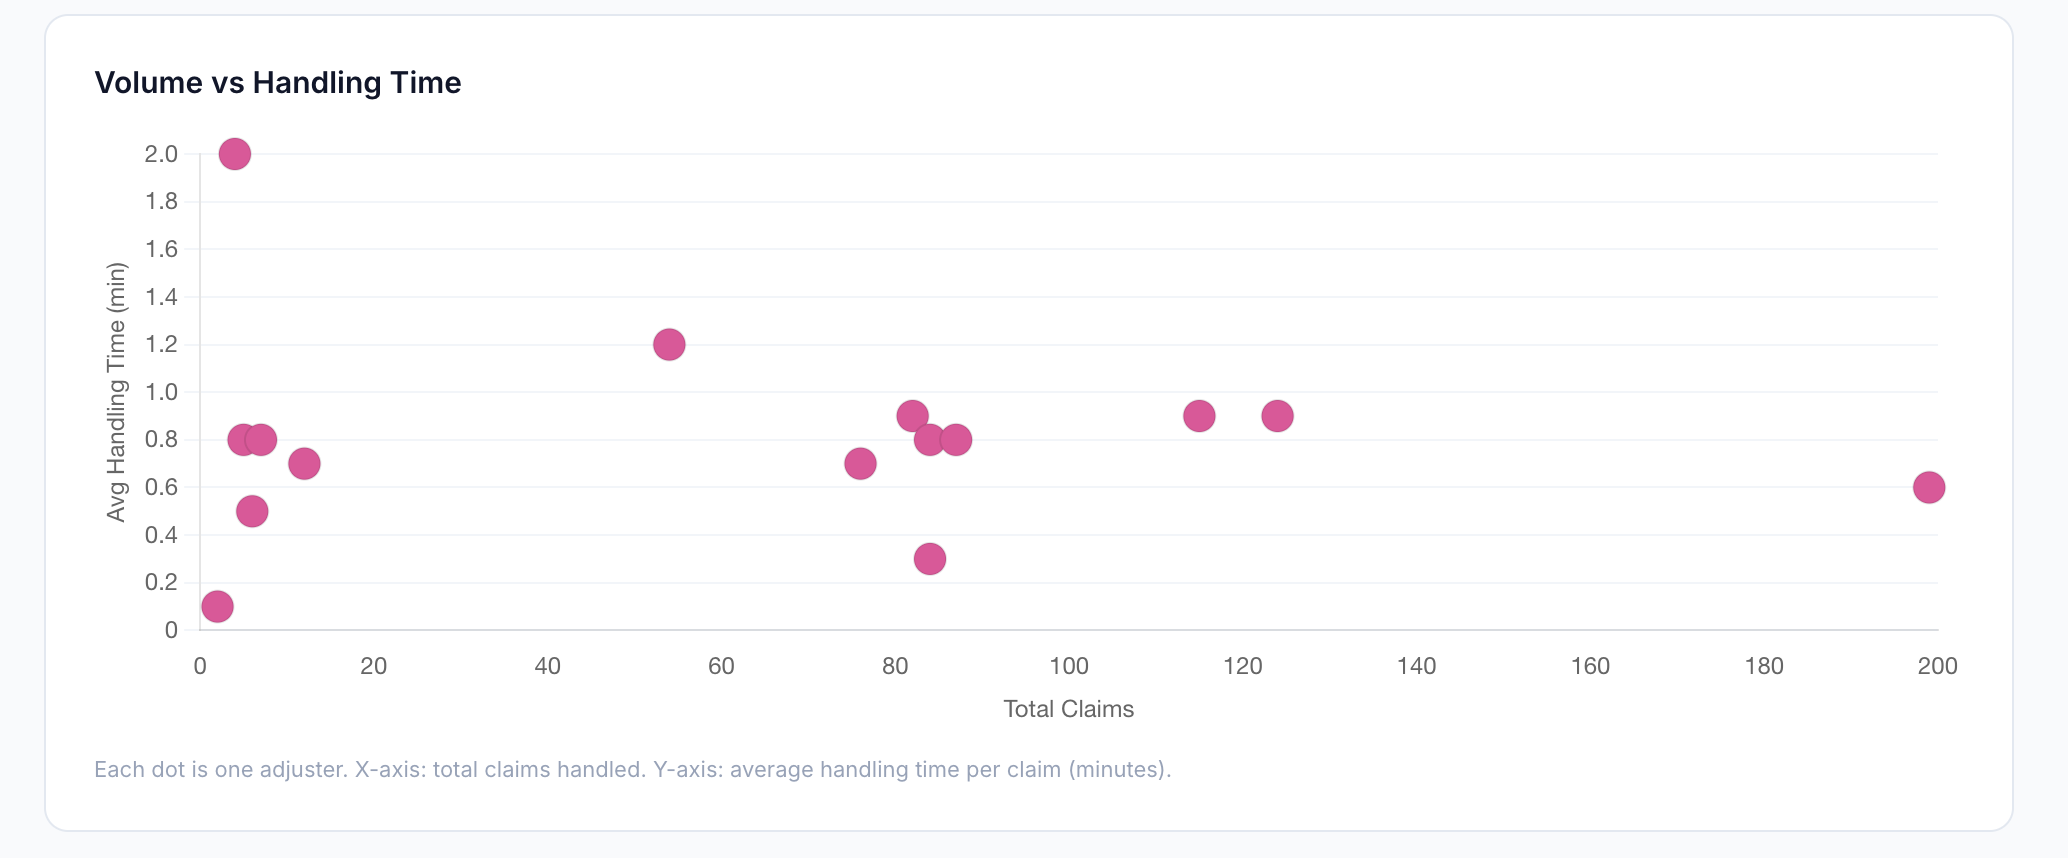
The scatter below, from the Pyze demo environment, illustrates this. Each dot is one adjuster, plotted by total claims handled against average handling time per claim. The handling times fall in a fairly tight band across very different volumes. At this level, volume and speed appear unrelated and the team appears uniform. The useful questions appear one level down: what each person is doing between claims.
Where Automation Candidates Appear
Automation candidates are rarely visible at the case level. They appear at the task and activity level as repeated, manual, high-frequency work: the same lookup, the same copy between two screens, the same check run on every case.
After the work is decomposed, each task can be scored on how often it occurs and how much effort it takes. Tasks with high frequency and high effort are the first candidates to review. Tasks with low frequency and high judgment usually should stay with a person. This distribution supports the decision between standardizing, simplifying, automating or assigning a step to an agent.
A baseline also has to be taken at the activity level to be reusable. After a change, the team needs to know which activities shrank, which disappeared and which moved to another person or system. A case-level before and after comparison cannot show this.
Reaching Task and Activity Level Without Additional Surveys
The traditional method for reaching task and activity level is a time-and-motion study. It is slow, it samples a small portion of the work, and it changes behavior while it runs.
Continuous capture provides the same information without those limitations. Pyze records interaction metadata across the applications in scope: which application, which screen, and the sequence and timing of actions. It does not capture keystrokes, field values, free text or screen contents, and it uses pseudonymous identifiers. The unit of analysis is the process, not the person, so the output is a map of how the work flows and not a scorecard for individuals.
A tier-1 Canadian retail bank used this approach in place of manual time-and-motion studies across 1,100 retail centers and 11,000 employees, and identified $3M+ in operational cost and 50K+ hours.
Where to Go Next
- See how Productivity Intelligence baselines work from process down to activity.
- Read about A Conservative Model for Estimating Reclaimable Capacity once you have a baseline.
- Browse the use cases to find the process closest to yours.